This is a supplementary material for a class. (A work in progress)
From dynamic analysis to doing some low level debugging, gdb will be your friend when it comes to debugging linux binaries. I would suggest installing some extension to add onto gdb (since vanilla gdb is pretty hard to work with. It has many features out of the box, but a lot of them are hidden behind different commands).
Today I will be going over the binary that I showed last time in ghidra. You can download the binaries here (x86) and here (ARM). Then I will also go over your part 1 of the assignment 2.
Setting up GDB
For all intent and purposes, GEF is useful for most different
architectures. Here are a few ways to install it:
1
2
3
4
5
6
7
8
9
10
# via the install script
## using curl
$ sh -c "$(curl -fsSL http://gef.blah.cat/sh)"
## using wget
$ sh -c "$(wget http://gef.blah.cat/sh -O -)"
# or manually
$ wget -O ~/.gdbinit-gef.py -q http://gef.blah.cat/py
$ echo source ~/.gdbinit-gef.py >> ~/.gdbinit
When you use gef, you are able to see more with gdb, and it colors your terminal to make it more appealing. Later you will also see that gef will print out all the registers/assembly code to help you debug code more effectively.
There are older extensions like peda and pwndbg, but they are either not super up-to-date or do not support as many architectures as gef does.
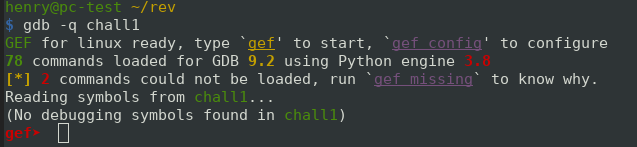
Once you set up gdb-gef, you will get a prompt like this:
Running a program
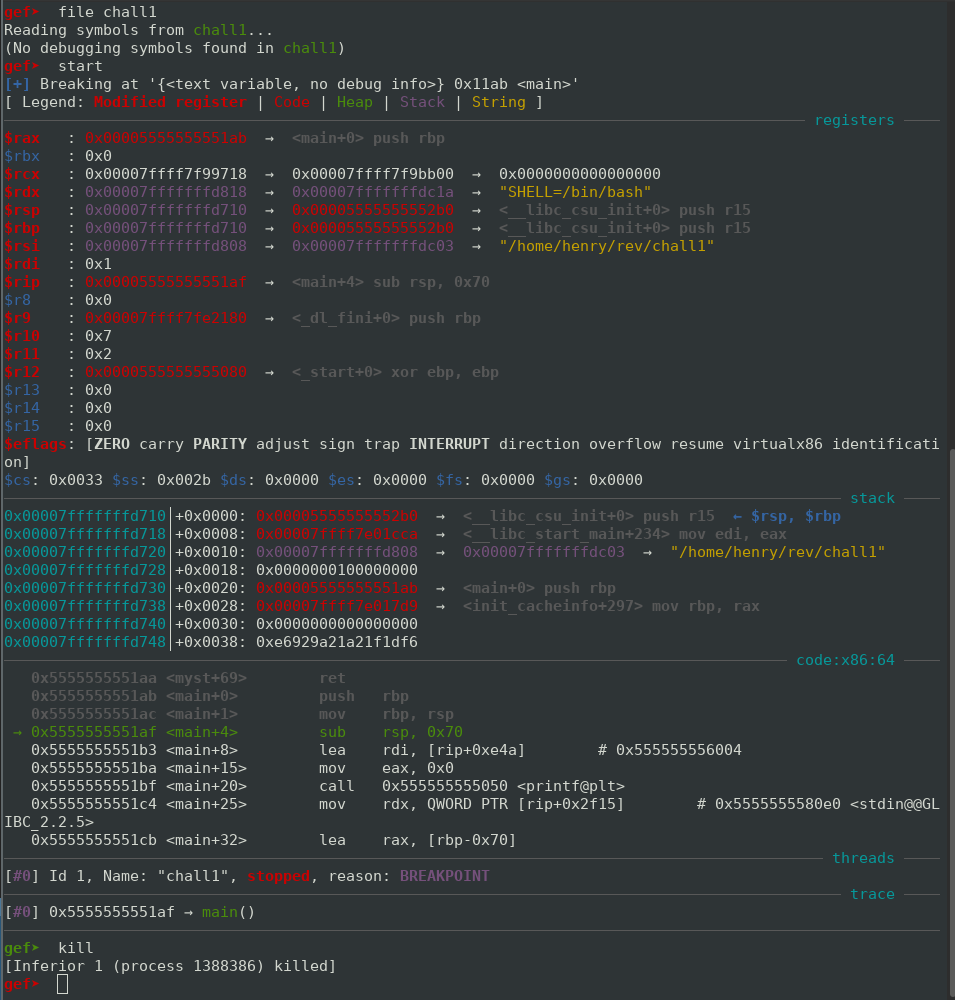
To start up a program in GDB, you will have to load the program. You can do so in two manners:
- You can pass the name of the program as a command-line argument to gdb
itself, i.e.
gdb myprog. - You can load the program on the gdb prompt with
file myprog.
After loading the program, you need to run it. You can use the run command to
start the program, or use the start command and have gdb immediately break on
the entrypoint of the program (either the real entrypoint or at main if gdb
can find where the main function is).
Note: If you want to pass command arguments to the program you are running you can pass them as arguments to the
runorstartcommand. If you want to pipe a file as input into the program you can use specify that input file as< myInputFileas you would normally do on a command line.
When you want to stop the program you just run the kill command to kill the
process.
Stepping and Breakpoints
This is something you probably will likely use very often. Whenever you set a
breakpoint, you are telling gdb to stop the program whenever it reaches
some location. To set a break point, we use break command to do so.
You can either then pass in an address or an expression, examples: break
*0xdeadbeef or break *myfunc+100.
WARNING: Make sure to always place an asterisk (*) before your expression or address, otherwise
breakmight complain some odd error message.
Previously, we learned that this binary reads in your input, and for each byte,
runs this myst function, and then compares it to some array called flag. If
we can figure out what input values result in what output values, we win.
Let us set a breakpoint right before our call to myst.
1
break *main+163
Note: to clear all breakpoints, type in
del. To clear only one breakpoint, specifydel breaknumwhere breaknum is the breakpoint number.
So now let's talk about a series of commands to move around in gdb:
stepiorsi: step one instruction in the programstepors: steps one line in source code. If there is no source associated with this particular code, it does the same asstepi.
Now imagine you are about to call a function but don't want to step into the
function (stepi or step will always go into a function). You can instead use
nexti/ni or its related next/n command to step over this function.
What if you accidentally stepped into a function and want to exit from it? Use
can use the fin/finish command to exit out of a function.
In this demo, I show how you manipulate gdb to move around in this code. I
also use the c or continue command to let gdb resume the program, until it
reaches the next breakpoint (or if it hits the same one again).
Now can we do any better? Let's try to define a gdb hook that prints out the letter and it's output value at each time. See here.
Printing and reading memory
Anatomy of a buffer overflow
Addendum I
If you are struggling with some errors liveoverfow provides some common errors that you can try troubleshooting first.